Are the MHRA releasing all of their injury reports?
New evidence indicates they are not and by a long way
“Safety is our watchword and we are globally recognised for requiring the highest standards of safety, quality and effectiveness for any vaccine” - Dame June Raine - CEO of MHRA
Before the start of the Covid-19 vaccination campaign, the MHRA were preparing for a large number of adverse injury reports. Indeed, they were expecting 1 injury report per 1000 doses on the basis this was a new vaccine, their explanation for requiring a new AI system at a cost of £1,500,000 to process these expected large numbers of reports.
By 29th September 2021, an unprecedented 370,574 Yellow Cards had been received into the hands of the MHRA from this one class of product, well over a decade’s worth of normal reporting across, well, everything. Their perspective, if you can get any, is that there were between 3 and 6 reports per 1000 doses, as they published without any excuse, well above their expectation for a new vaccine which towards 100 million doses administered at this point, was a bit of a stretch to call it “new”.
29th September 2021 is an important date because this was the last data release to the public before the forthcoming booster shots being rolled out only days later. However, it took until 4th November for any data on injury report numbers to come through even though the Summary of Yellow Card reporting, the MHRA’s way of being transparent with the public, is published weekly. When the data finally did come through, these numbers turned out to be much lower than expected, at about only 1 report per 1000 doses. Death reports also were, at least compared with before, at a trickle. Yet, there was no mechanism for this substantial change and so suspicion was around that reports were now being withheld.
It was not well known that Yellow Card reports actually made it into the VAERS database, at least an impression of what the MHRA might possess at their end but upon closer inspection, buried in the reports were something very interesting. Very.
Example
Did you notice those codes after the highlight?
1) GB-MHRA-WEBCOVID-20210109135858. It turns out that the first 8 numbers after WEBCOVID represent the date of entry, in this case, the 9th Jan 2021. I found that typing in WEBCOVID plus the desired date provided the most usable means of date searching to tie appropriately with the next coding type.
And you would find this:
2) GB-MHRA-ADR 24575544. Now you see that code on the end? Multiple searches revealed the ADR numbers would rise on later dates, revealing the code was sequential, a very useful finding to determine how many inputs were being used. How much they would rise compared to how much they should is the key question.
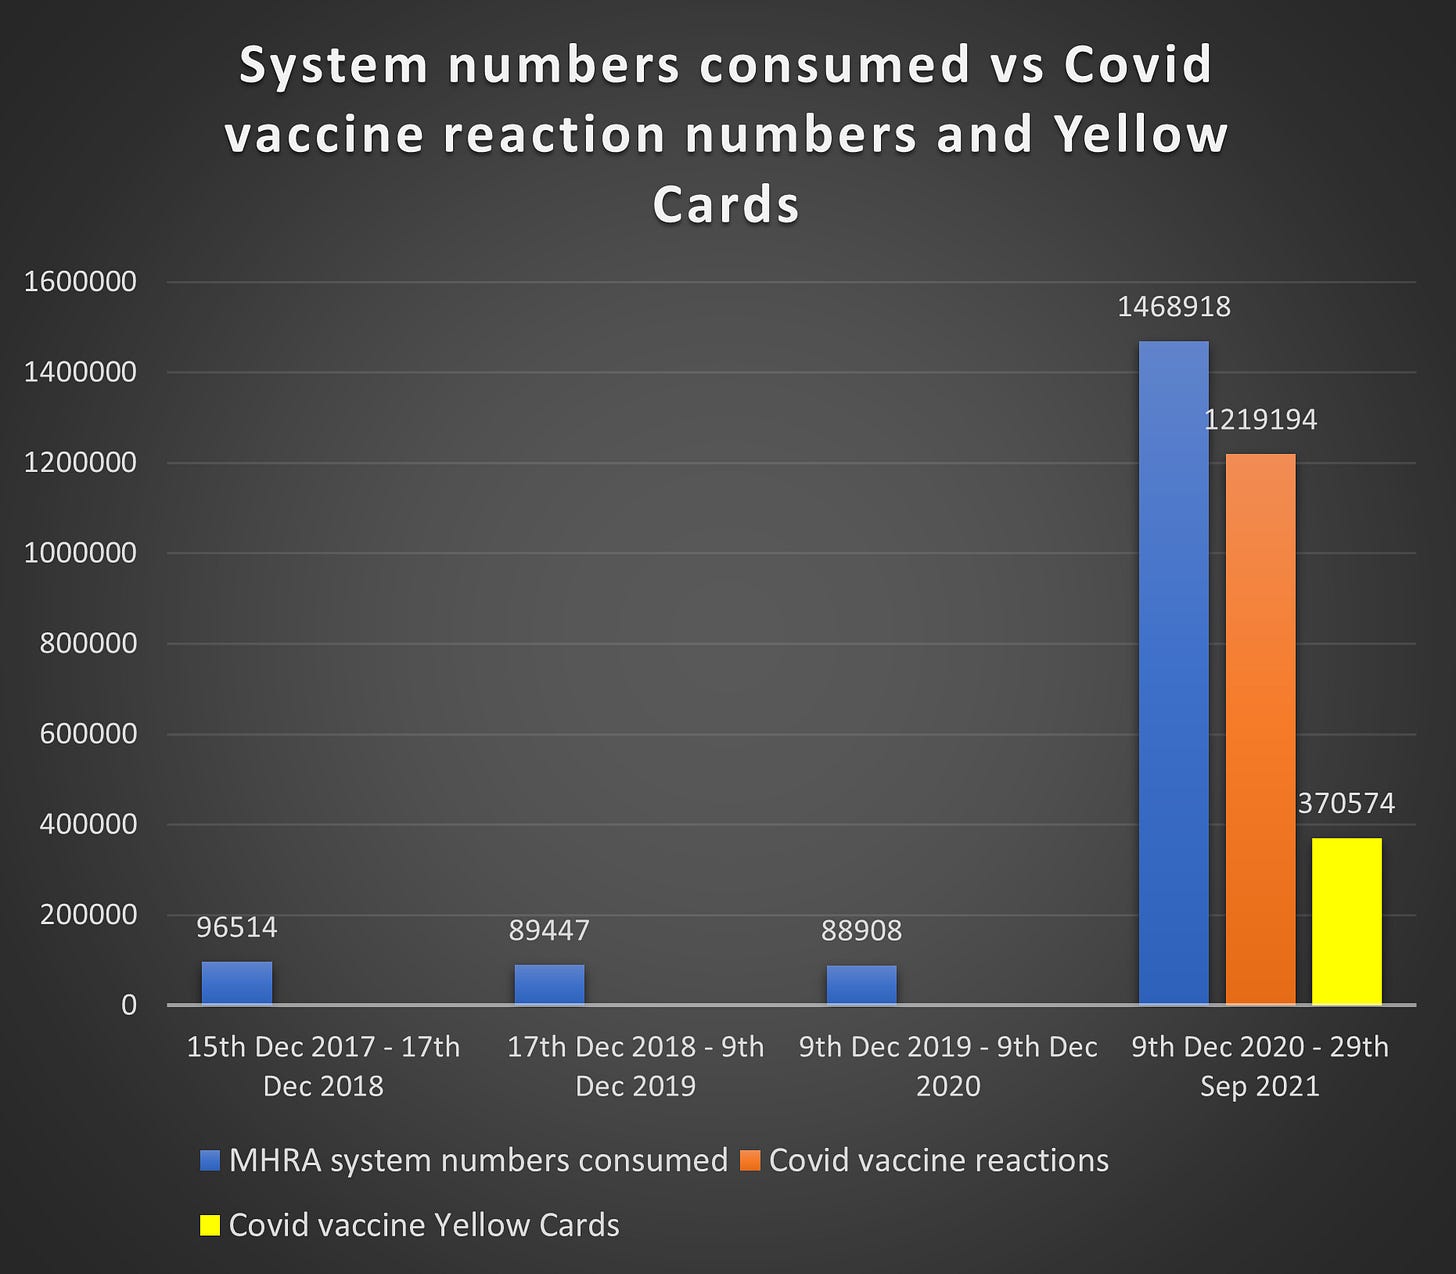
But before that, this is what rough yearly data looked like up to just before the initial booster shots. The fulcrum is 9th Dec 2020, the date of the first injury report. WEBCOVID codes were not available so did the best I could. Note that final tower is only 10 months!
But how does their system work? Even the Yellow Card total for the Covid vaccine was “only” 370,000 or so up until this point. What could explain nearly 1.5 million entries?
As the MHRA points out, a Yellow Card may contain more than one adverse reaction. Currently, the average number of reactions found on an injury report for the Covid vaccine is over 3 and as you can see, that particular tower could explain the nature of the missing numbers even if the final total wouldn’t perfectly match.
It was indeed around the time of the initial booster shots that I last had a really good look at the data. Unfortunately, foreign reports (to the US) have since been removed from the VAERS database, little doubt due to the reports being too revealing. However, thanks to WelcomeTheEagle88 (linked below), I received an Excel spreadsheet containing foreign VAERS reports dated up until that removal. Although not confirmed, I kept the assumption that both Reactions + Yellow Cards cause a rise in input reference codes.
So the big question, are the MHRA releasing everything to the public?
DISCUSSION
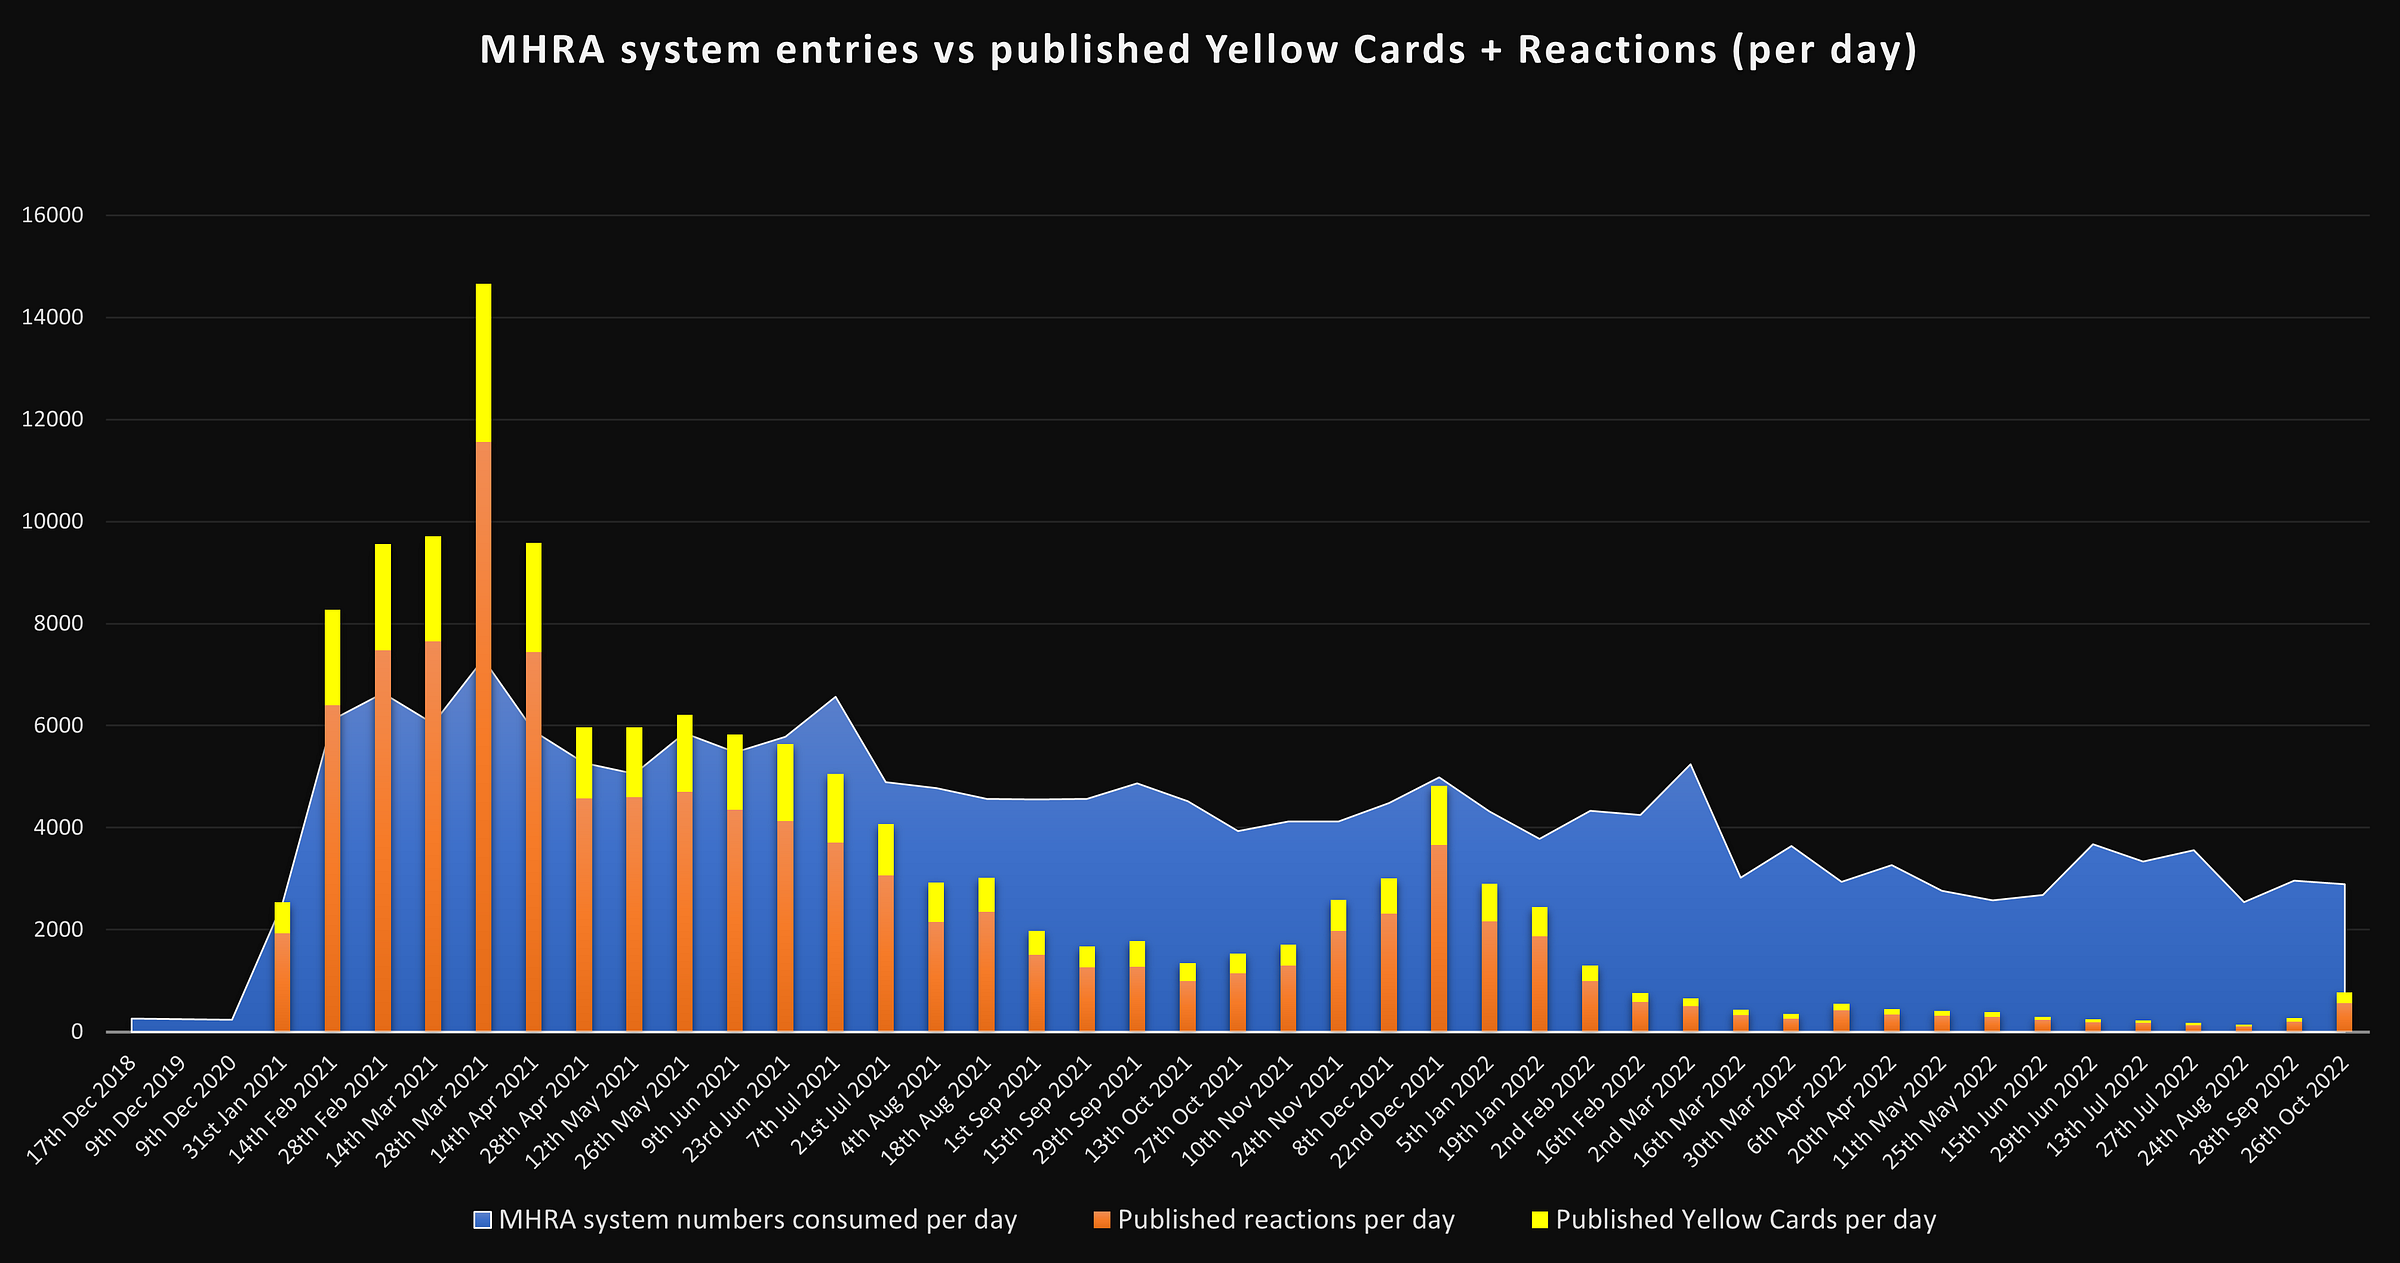
As you can see there is a MASSIVE problem. The iceberg is enormous and it would be easy to miss that it is still extending. The missing numbers do not even have to be the number of reactions to know something looks very wrong about this. Note the sparse date intervals at the end of the graph, MHRA reports have been becoming ever more infrequent yet someone is busy on the keyboard.
Also notice the publishing numbers spike on the 28th March 2021, way beyond the input numbers consumed. Although the MHRA encouraged electronic reporting rather than paper, how much of a processing backlog did they have?
Well, it sure does look like there was chaos inside the MHRA and the graph indicates it took them a long time for them to catch up if using the stated assumptions, that point perhaps arriving around February 2022. After that, activity would have been expected to almost cease yet entry numbers consumed in their system were roughly 2500 - 5250 daily compared with 140 - 775 entries for the Covid vaccine Yellow Cards and reactions combined. So what could explain this rather large discrepancy?
If I were to provide an explanation, perhaps these numbers could be explained by indirect reports, that is, Yellow Cards received from the pharmaceutical companies rather than directly from a doctor, pharmacist or patient. Basically they would be duplicates. However, this would seem unlikely. As I’ve shown, there were roughly 88,000 - 96,500 numbers on their system consumed per year pre Covid vaccine but this would seemingly not fit all the Yellow Cards and reactions twice over, as the rather normal figure of 26,000 Yellow Cards received for 2018 would demonstrate. Times that by 2 and you have 44,500 or so reference numbers left over to explain reactions on 52,000 Yellow Cards. It doesn’t work.
See S Chaplin for Yellow Card numbers and insight https://wchh.onlinelibrary.wiley.com/doi/abs/10.1002/psb.1789
Perhaps then vast numbers of Yellow Cards reports have been upgraded to “cases”. Some indeed are referred to as cases in their Weekly Summary of Yellow Card Reporting but the numbers seem relatively small as they tend to be for stated events like blood clots and myocarditis which are “only” in the low thousands, at least what they are admitting too.
It’s not looking good that’s for sure. Perhaps it really is what it looks like.
HOW MANY YELLOW CARDS COULD THERE BE MISSING?
*Over 1 MILLION EXCESS reference numbers were used from the start of the Booster rollout. That is after factoring in any Covid vaccine Yellow Card and reaction inputs. * It’s a highlight to the absurdity but won’t factor into any calculations
In 2022, input numbers were often 10X higher than published Yellow Cards + Reactions. The fortnight up until 27th July hit over 20X higher.
Pre Booster, there were 3.29 reactions per Yellow Card
2,879,756 system entries were made from 9th Dec 2020 - 26th Oct 22
1,527,584 reactions and a further 470,023 Yellow Cards were published for the Covid vaccine until 26th Oct 22
The excess when it’s all said and done, taking into account Pre Booster and After Booster is 882,149 references unexplained in excess to the Covid vaccine.
But wait a minute. We need to factor in other products. Let’s now assume an additional 200,000 system numbers should have been consumed for that period, a little generous maybe?
882,149 minus 200,000 is 682,149 leftover.
682,149 divided by (1 Yellow Card + 3.29 reactions)
POTENTIAL MISSING YELLOW CARDS = 159,009+
For a system so determined by the Covid vaccine, urgent questions need to be asked as to why the system has been so active despite the dramatic fall off in injury reports.
How dangerous are the Boosters really and are injury reports being throttled back worldwide?
MHRA AI contract: https://ted.europa.eu/udl?uri=TED:NOTICE:506291-2020:TEXT:EN:HTML&src=0
29th Sep 21 Weekly Summary of Yellow Card Reporting: https://web.archive.org/web/20211013102043/https://www.gov.uk/government/publications/coronavirus-covid-19-vaccine-adverse-reactions/coronavirus-vaccine-summary-of-yellow-card-reporting


Another thing to take into account is the consciously, wilfuly complicated process TO actually successfully input obvious vaccine injuries INTO the yellow card system. I personally know of MANY people who had relatives who were fit & healthy and got a 2nd or booster jab, became very ill or died quickly afterwards, who (A) said that the process
of inputting a report was so needlessly complicated as to have given the clear impression of it being DELIBERATELY so, many, if not most, having actually GIVEN UP! & (B) The burden of "proof" demanded that it WAS in fact vaccine related was so high, (everybody who dealt with the victim, from G.P. to EVERY clinician and physician, doctor, medical personnel ALL having to be in unanimous
"lockstep" that it WAS a vaccine injury, when, of course, we KNOW that THOSE coward's and liars kept their damn mouths SHUT because they absolutely faced being fired AND losing their license to practice medicine too, or, in the USA, even CRIMINALIZED!). There is premeditated corruption BUILT INTO these reporting mechanisms, and yes, they absolutely ARE throttling these reports and numbers too. In the UK, the BBC STILL gleefully lie that there have been NO "confirmed" deaths from the pseudo vaccine.
Excellent! I’ll help get this info launched into the jet stream!